Customizable Dashboard
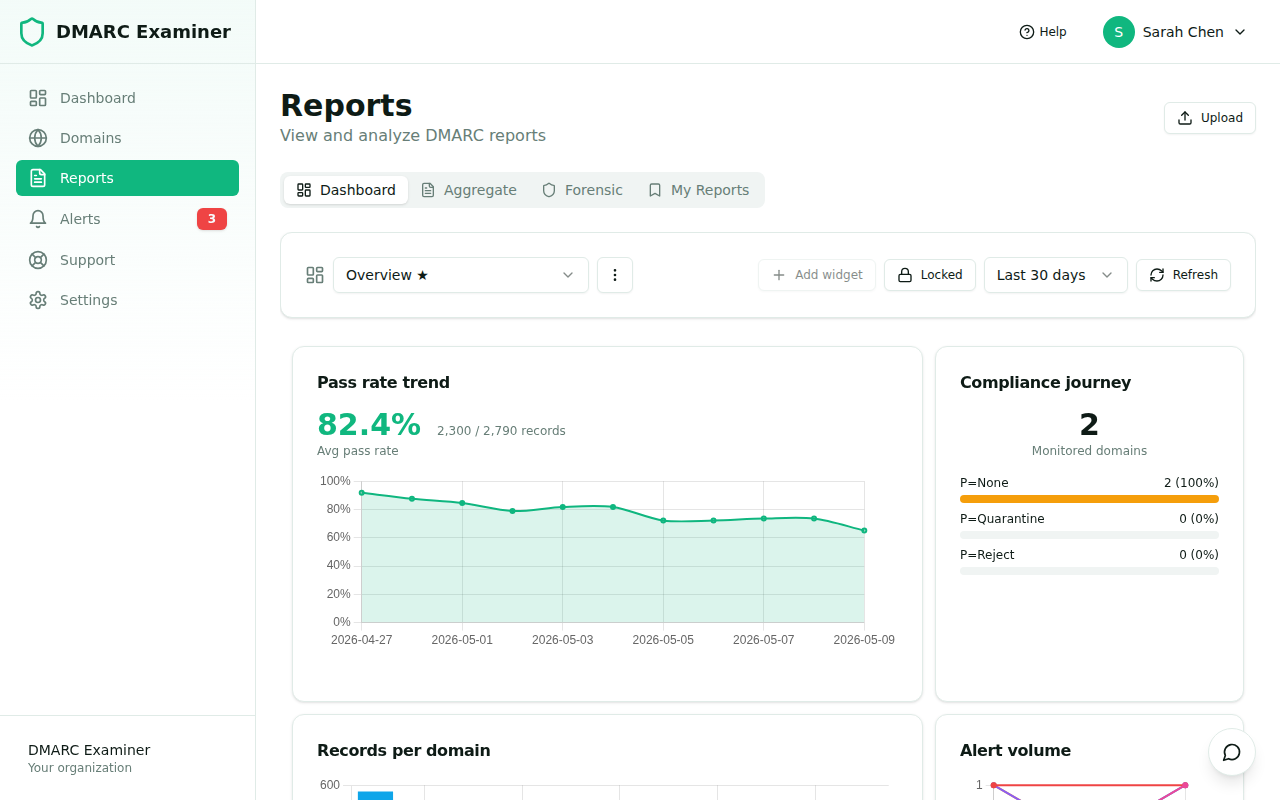
The Customizable Dashboard turns the Reports area into a personal control panel. Pick the widgets that matter to you, lay them out in a grid, and keep the same view across sessions. Each user can have multiple dashboards (for example "Compliance overview" and "Incident triage") and switch between them in one click.
Plan: Customizable Dashboards are available on the Basic plan and above (feature flag
customReports).
Where to find it
Inside the app, go to Reports → Dashboard. If your plan includes Customizable Reports the tab appears next to "Aggregate" and "Forensic". The first time you open it we auto-create an "Overview" dashboard with seven widgets so you have a useful starting point.
Widget catalog
The current widgets all sit on top of your existing DMARC data — no extra ingestion needed.
| Widget | What it shows |
|---|---|
| Pass rate trend | Daily DMARC pass rate as a line chart. |
| Records per day per domain | Stacked bar of the report volume your domains see. |
| Top failing ASNs | The ten autonomous systems sending the most failing records. |
| Top failing countries | The ten countries where your failures originate. |
| Alert volume trend | Alerts created per day, split by type. |
| Compliance journey | Distribution of your domains across DMARC policies (none/quarantine/reject). |
| Top senders | The ten source IPs sending the most volume to your domains. |
A global date range picker at the top of the dashboard (last 7, 30 or 90 days) applies to all widgets at once — there is no per-widget time override.
Edit mode
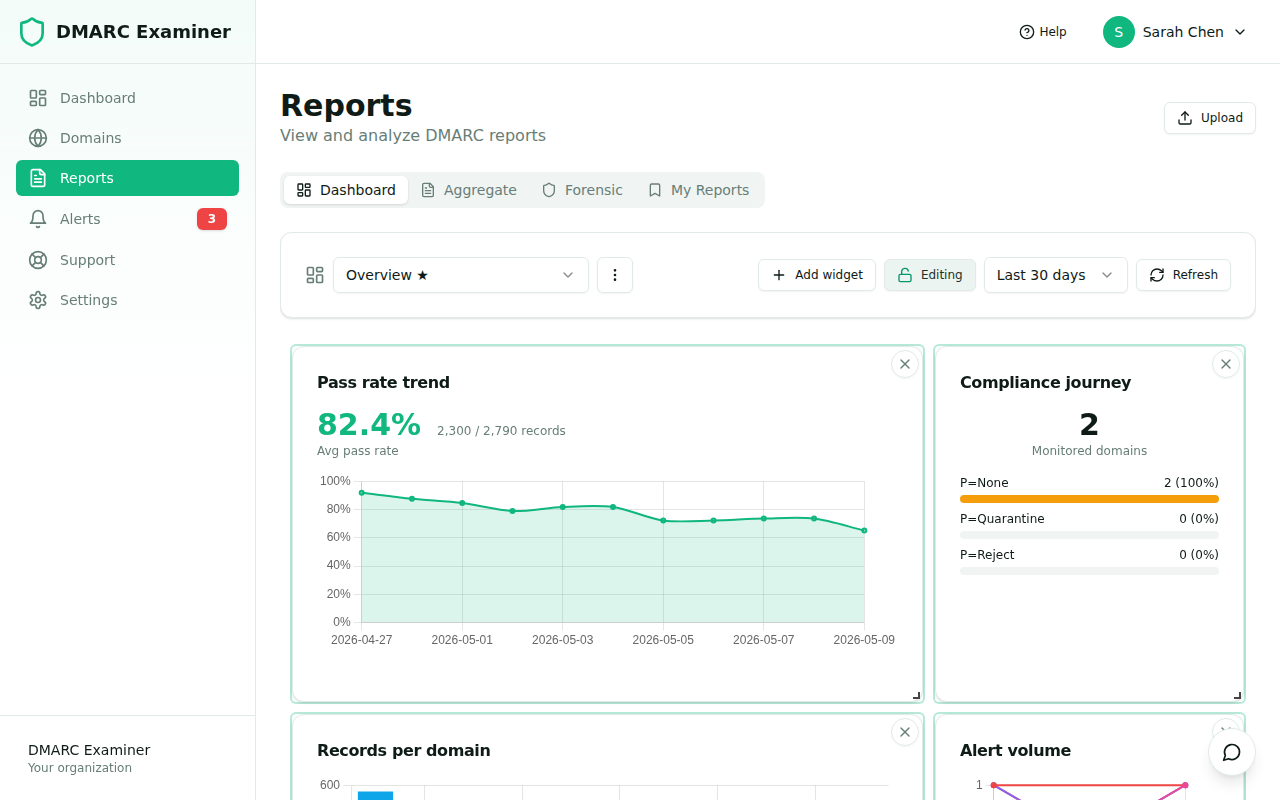
Click the Locked / Editing toggle in the header to enable drag and resize. While editing:
- Drag any widget by its header to reposition it on the grid.
- Use the bottom-right corner handle to resize.
- We auto-save the layout 600 ms after you stop moving things — there's no "Save" button.
Click the toggle again to lock the layout and prevent accidental moves.
Multiple dashboards
The selector in the header lets you switch between dashboards. To create a new one, open it and choose New dashboard. You can:
- Mark one dashboard as the default — it loads automatically when you open the Reports area.
- Rename or delete dashboards at any time.
- Have unlimited dashboards per user; we don't impose a hard cap.
Caching and freshness
Widget data is cached for 5 minutes in Redis to keep the page snappy. When a new DMARC report is ingested for any of your domains we automatically invalidate the cache so you don't see stale numbers. You can also force a refresh with the Refresh button.
Frequently asked questions
Can I share a dashboard with my teammates? Not in v1. Dashboards are user-scoped. Saved filters cover the "shared view" use case (see Saved Filters).
What happens if I delete a domain? Widget configurations that pointed at that domain are cleaned up automatically. Widgets that filter by domain show "no data" gracefully if all of their domains are gone.
Can I export a dashboard to PDF? Branded PDF exports of dashboards are part of the Ultimate plan — see Branded Exports.