Dashboard
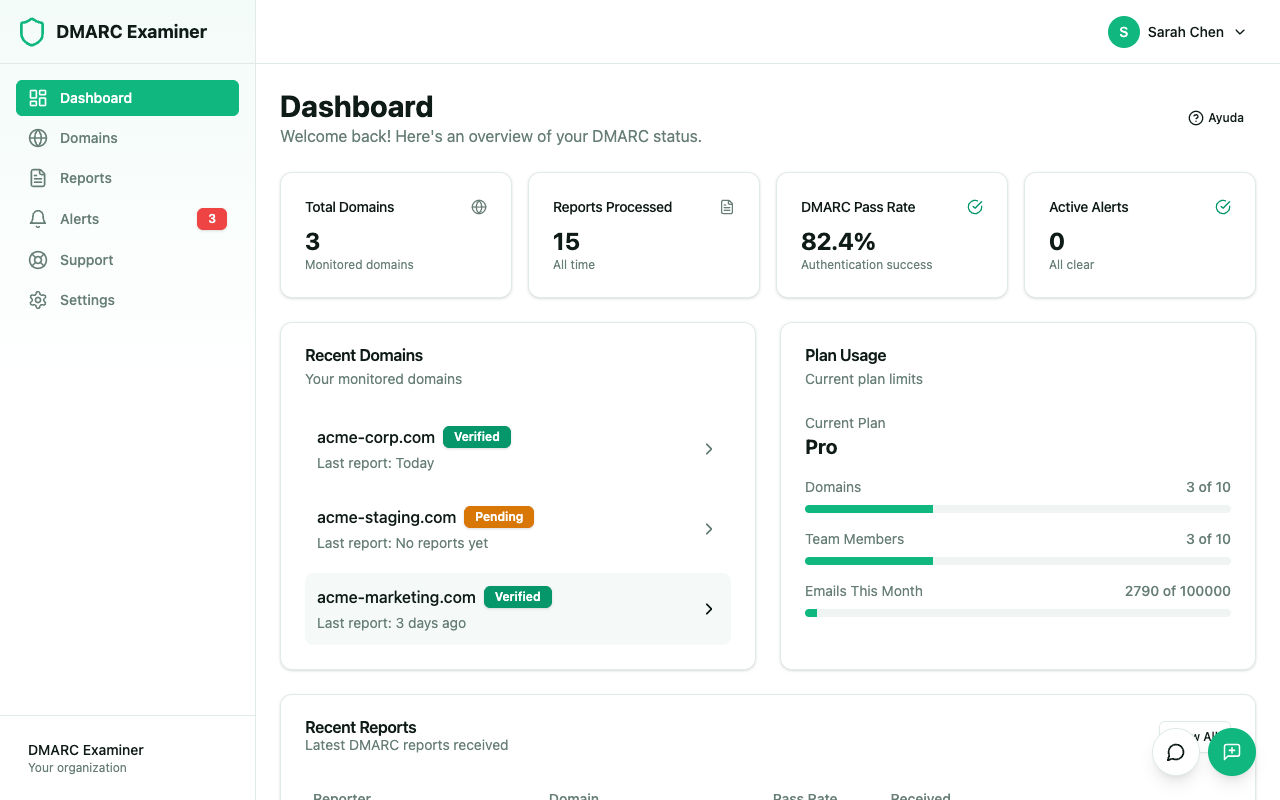
The Dashboard is the main screen of DMARC Examiner. It provides a quick overview of your domain monitoring status, recent activity, and plan usage.
Stats Overview
Four summary cards are displayed at the top of the dashboard:
- Total Domains — The number of domains currently being monitored in your organization.
- Reports Processed — The total number of DMARC reports received and processed across all time.
- DMARC Pass Rate — The overall percentage of emails that passed DMARC authentication.
- Active Alerts — The number of alerts that currently require your attention.
Recent Domains
A clickable list showing up to 5 of your most recently active domains. Each entry displays:
- The domain name
- A status badge (Verified, Pending, Failed, or Expired)
- How long ago the last report was received (e.g., "Last report: 2 days ago")
Clicking on a domain takes you to its detail page.
Plan Usage
Shows your current plan name along with usage bars for:
- Domains — How many domains you are using out of your plan limit
- Team Members — How many team members are active out of your plan limit
- Emails This Month — Monthly email volume tracked against your plan allowance
When you are approaching a limit, an upgrade prompt is displayed.
Recent Reports
A table showing the last 5 DMARC reports received. The columns are:
- Reporter — The email provider that sent the report (e.g., Google, Microsoft)
- Domain — The domain the report is about
- Pass Rate — The DMARC authentication pass rate for that report
- Received — When the report was received
A "View All" button takes you to the full reports list.
Updates
Dashboard data is updated automatically when new DMARC reports arrive, usually every 24 hours.